News

24 December 2020
Asymmetric trade flows create a massive transfer of biophysical resources from poor to rich countries
In earlier articles dealing with the plunder of Africa, inequality and the role of borders in the global economy, we have had the opportunity to show how the global economic system organised the transfer of money and value from poor to rich countries.
In this article, we will discuss another facet of the world economy, namely, to what extent our economic system structures an unequal exchange of physical resources that has critical implications on development potential of different countries and regions. To consider the physical dimension of human activities appear to be particularly opportune, in our view, in times of climate change and COVID-19 pandemic [read].
For this, we will use results of the work presented in “Global patterns of ecologically unequal exchange: Implications for sustainability in the 21st century”, a paper published recently in Ecological Economics by a group of researchers. This paper provides empirical evidence of “asymmetric net flows of biophysical resources from poorer to richer countries” for the period 1990 to 2015.
In a nutshell, as money continously accumulates through trade in the hands of the richer countries, so do physical resources, following the same path, to the detriment of the rest of the world and its development potential.
The data presented are result obtained from environmentally extended multi-regional input-output models. They are structured along four biophysical resource categories (materials, energy, land, and labour) and compares the monetary exchange value of resources embodied in goods traded between rich and poor countries. The analysis “includes 170 countries, encompassing 99.2% of the world population in 2015, and the bulk of global supply chains and economy-wide resource flows”. Countries are divided into six groups of approximately the same size of population but with a decreasing level of income: high income countries, upper-middle income countries, China, lower-middle income countries, India and lower income countries.
Underlying theory and limitations
The paper is based on “the theory of ecologically unequal exchange [which] proposes that in addition to market power asymmetries [considered in conventional economics], there are neglected asymmetric transfers of biophysical resources … [that] are crucial for the capacity of cities, nations, and regions to accumulate technological infrastructure and achieve economic growth”. For this theory, the “attribution of higher value to commodities representing lower remaining productive potential inexorably leads to asymmetric transfers of resources”. Also, “countries rich in economic, technological, or military power are more likely to gain access to resources (materials, energy, land, and labour) that are relevant to continued economic growth and for building technological infrastructure. As a result, resources flow asymmetrically, with net transfers from poorer to richer regions … and resources of richer regions are compensated higher compared to those of lower-income regions,” leading to extractivism.
The main limits of the method used in the study are: (i) it does deal with intra-country unequal exchange among regions which can be of importance in countries such as Brazil or India; (ii) the models used fit with the data available but this does not necessarily mean that these models (and the underlying theory) are “correct”; (iii) the dataset analysed has limitations.
The main evidence gathered from the study can be summarised as follows:
-
•Regarding high-income countries:
-
•They used more resources from a consumption perspective than they provided through production. As a result, their raw material requirements (including that which is embodied their resource use) exceeded their domestic extraction by 10 billion tons per year, while other groups had their production overrunning their consumption of resources. This difference was imported from other groups
-
•They were also found to have a very large energy footprint. This is quite consistent with results from other sources [read].
-
•Additionally, they emerged as the biggest net appropriators of land: 31% of total global land used (including, of course, land incorporated in imported goods).
-
•Besides, they were the only group that was not a net labour provider.
-
•Finally, they achieved a monetary trade surplus (around $1200 trillion over the period) and generated more value-added than all the other groups combined, China and India included!
-
-
•Regarding China:
-
•China achieved the greatest monetary trade surplus ($1900 trillion) but exported its natural resources (except for land).
-
-
•Regarding the three groups of lower income countries (lower-middle, India, and lower income), they play a relatively marginal role in international trade and are generally exporting their natural resources, but for India in the case of land.
The diagrams below illustrate the flows estimated the study team.
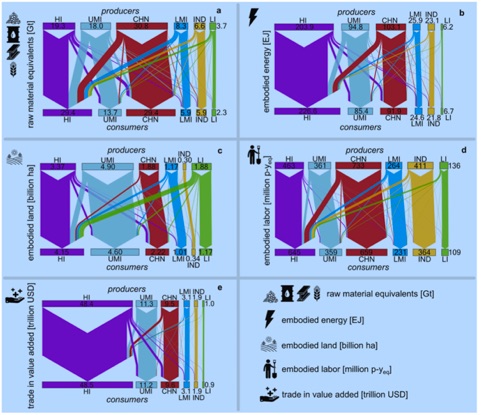
Source: C. Dorninger et al., 2020. download diagram: Sankey diagrams.png
Note: Sankey diagrams exhibiting production and consumption of resources in each income-based country grouping (high-income HI, upper-middle income UMI, lower-middle income LMI, low-income LI), China (CHN) and India (IND) in 2015. Flows represent the redistribution of resources through trade. Note that money (as consumer expenditures) and resources flow in opposite directions in trade relations, i.e. money flows from consumers to producers. However, embodied value added is aligned in the same direction as embodied resources (e).
There is one result that illustrates perfectly the power balance imposed by the existing system: the value added embodied in a tonne of material exported by rich countries is 11 times bigger than in a tonne of material exported by low income countries, and 28 times by unit of labour incorporated ! In other words, a poor country will need (on average) export 11 times more material than a rich country in order to generate an equivalent value added. Similarly, a national living in a poor country will need to work (on average) 28 times more than a national of a rich country in order to generate the same value added (and one can therefore expect that the revenue of workers will roughly vary in comparable proportions).
The paper goes into further analysis and those readers interested are invited to read it.
Two points made by the authors are particularly worth mentioning as they feed into the larger development debate:
-
•The study shows a significant negative effect of biophysical reserves on technological adaptation, suggesting that “countries rich in biophysical resources tend to fall behind in technological development”. This statement is quite consistent with the existence of what has been called in specialised development literature the “Natural Resource Curse”.
-
•The differences in the monetary compensation of materials, energy, land, and labour embodied in traded goods seem to be “mostly determined by the countries’ income level, implying that poorer countries hold positions in global supply chains that determine low monetary compensation for resources and products they sell. Conversely, the export of high value-added products from richer countries enables them to produce a higher gross national income to maintain high and import-dependent resource throughputs and inputs.” The authors explain this as being at least partly because of underlying differences in labour productivity, but we have seen elsewhere that there are other factors involved, in particular the labour market segmentation due to international borders that prevent the international movement of labour force, that are indispensable to perpetuate this system [read].
When finding out about these flows, we cannot be surprised by the fact that inequality in the world is on the increase, and we understand the mechanism by which this inequality is perpetuated and amplified, condemning poor countries to a “mining” economy where wages are, on average, quite low.
As we are on Christmas Eve, it may be time for a small one-question quizz:
-
-After money, value and biophysical resources, what is the other factor of growing importance in our economy, whose flows would need to be analysed?
The answer is:
-
-Information and data*!
------------------
Note:
* on the data issue in food, read here
—————————————
To know more:
-
•C. Dorninger et al., Global patterns of ecologically unequal exchange: Implications for sustainability in the 21st century, Ecological Economics, 2021.
Selection of past articles on hungerexplained.org related to the topic:
-
•Opinion: Back to reality - Reflections around the COVID-19 crisis by M. Maetz, 2020.
-
•Plundering Africa (Season 2), 2017.
-
•Opinion: How to stop the global inequality machine by J. Hickel, 2017.
Last update: December 2020
For your comments and reactions: hungerexpl@gmail.com