Natural resources:
Water (2022)
Download Water_2022.pdf
Water resources:
water stress and pollution1
Agriculture is the first water user, and water stress is increasing
Irrigation plays a central role in agricultural production, and it has been a major factor underpinning its impressive growth over the last six decades. Its development radically changed global agriculture, spreading a type of agriculture based on the irrigated cultivation of high-yielding hybrid varieties benefitting from the application of large amounts of fertilizers and pesticides. In Asia, more than two thirds of the increase of cereal production is linked to the development of irrigation.
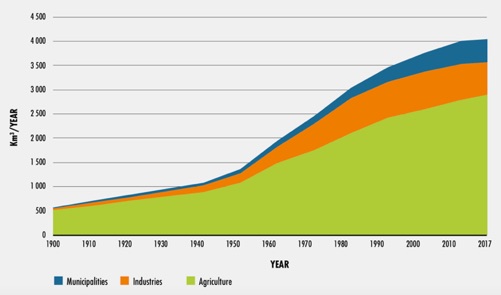
Fig.1: Global water withdrawals by sector
Source: FAO.
In 2007, according to FAO, irrigated agriculture provided already 40% of available food, including 60% of the cereals in the world [read], and its importance has been growing since. In 2019, 342 million hectares were equipped for irrigation, 18% more than in the year 2000, and more than double than in 1961 [FAO]. This trend, which was seen for decades as being favourable, as it contributed to make agriculture less dependent on meteorological conditions, has resulted in increasing the reliance of food production on the use of freshwater that is now threatened by climate change. From the economic point of view, it boosted activities the construction and machinery sectors (dams, canals, roads, pumps, etc.) and made agriculture a major buyer of agrochemicals (fertilizer and pesticides) from the chemical industry. With the multiplication of areas under water stress already observed today and it’s likely exacerbation because of climate change, what was thought to be an advantage, is turning out to be a problem.
Agriculture is by far the most water consuming human activity. It uses about 72% of freshwater in the world, mostly for irrigation, the rest being shared between industries and households in a 2/3 and 1/3 proportion, respectively (Fig. 1). Moreover, 41% of withdrawals for agriculture are not compatible with sustaining ecosystem services [read].
Out of the 110,000 km3 water that are provided by rain on the land surface of the earth, approximately 2/3 evaporate before arriving in the sea. This leaves around 44,000 km3/year of renewable water resources usable by humans. Withdrawals (all sectors included) amount to 4,000 km3/year [read]. This might seem minimal and could give the impression that there is plenty of water available. In reality, water scarcity is spreading. Moreover, water is increasingly polluted.
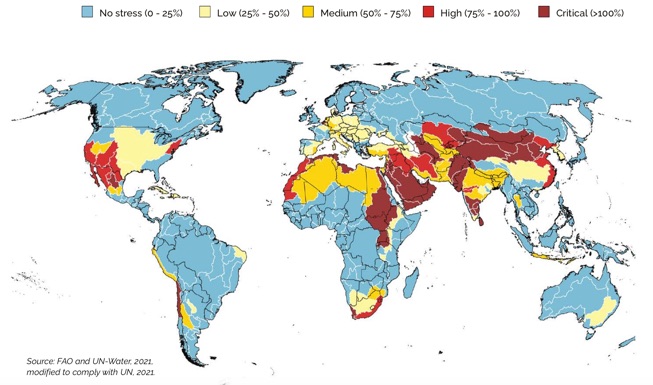
Water stress is measured by the ratio between freshwater withdrawal and total renewable freshwater resources. At world level, this ratio is of 18%, corresponding to a situation of no stress, but this good figure hides considerable variations from region to region (Fig. 2).
Europe is quite favoured, with a ratio of only 8.3%. In East and Western Asia, this ratio is between 45% and 70% corresponding to low to medium stress. In Northern Africa, the ratio is greater than 100%, indicating critical stress, as water withdrawn is more than available renewable resources.
Water stress is not just an issue of lack of physical availability of water: it also has an economic dimension, when countries and people, despite a relative abundance of water, do not have the financial resources to invest into adequate infrastructure and appropriate institutions to make this water available to meet their needs.
Fig. 2: Level of water stress by major basin in 2018
Source: FAO.
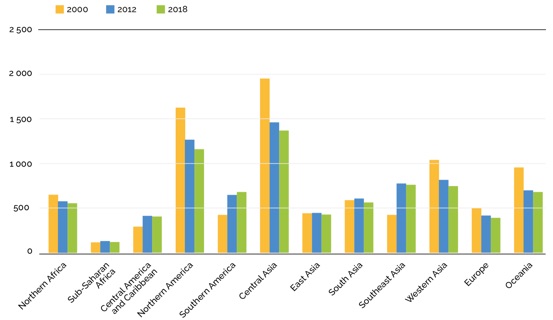
The quantity of renewable freshwater resources available per person varies considerably from region to region. It is highest in South America (around 30,000 m3 per person) and lowest in South Asia (only about 1,000 m3 per person). In Sub-Saharan Africa, it is below 5,000 m3 per person, and in Europe almost 10,000 m3 per person.
Climate change is likely to exacerbate water stress due to higher temperatures and evapotranspiration that it causes and because of modifications of rainfall distribution in time and space that will affect crop growth [read].
Fig. 3 shows the huge variations in terms of water withdrawal per person in different regions. It also indicates that, in many locations, availability per person has been decreasing since the beginning of the century. It is estimated that 3.2 billion people live in agricultural areas with high to very high water shortages or scarcity, of whom 1.2 billion people – roughly one sixth of the world’s population – dwell in severely water-constrained agricultural areas [read].
Note that 80% of the water used by agriculture comes directly from rainwater found in soil humidity (usually designated as green water). The rest of the water used in agriculture originates from rivers, water storage facilities, lakes and underground reserves (blue water).
The situation of groundwater resources is particularly worrying. In irrigation, groundwater represents around 30% of total water, and the volume withdrawn increases at a rate of 2.2% per year, threatening to deplete aquifers and creating more frequent saline water intrusions in coastal areas [read].
Fig.3: Total annual water withdrawal per person in different regions (in m3 per person)
Source: FAO.
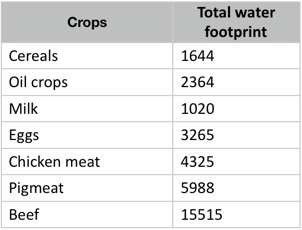
Meanwhile, demand for water per person continuously expands because of urbanisation and higher incomes, growing requirements from developing industry and services, and changing diets. Regarding food, higher incomes bring about consumption of more water-intensive foods (e.g. meat and dairy products) [read]. Table 1 gives the water footprint of a few food products. In a rich country like France, water (both green and blue) in food is equivalent more than 10 times water consumed for hygiene and sanitation [read].
Table 1: Water footprint of selected food products (litres/kg)
Source: Mekonnen and Hoekstra
This type of figures shown in Table 1, however, may show large variations, depending on the way food is produced: for instance, one kilogram of grain-fed beef, may require between 15,000 and 100,000 litres of water depending on how production is organised [read].
The example of China is quite striking (Table 2). Between 1981 and 2016, total agricultural water requirement increased by 66%. This was a result of population growth (+44%) and of a larger requirement of water/inhabitant (+20%). It is important to note that a large portion of the increase of water requirements/inhabitant observed is due to urbanisation, as urban people needed around 27% more agricultural water per person than rural people in 2016. Indeed, as people move to urban areas, their diet tends to change and become more water-intensive.
Table 2: Change in agricultural water requirements in China

Computed on the basis of He and al., 2021 and World Bank population data
Water quality is increasingly becoming a cause of concern.
Growing pollution of water becoming a major global threat that directly impacts health, agricultural productivity and food security. In fact, agriculture is at the same time a culprit (along with industry and other human activities) and a victim of the deterioration of water quality. As pollution increases, soils are unable store and degrade contaminants. With time, as the concentration of contaminants rises, the capacity of soils to cope with pollution is reduced: in particular, microorganisms living in the soil are affected by pollution and their power to degrade toxic contaminants decreases.
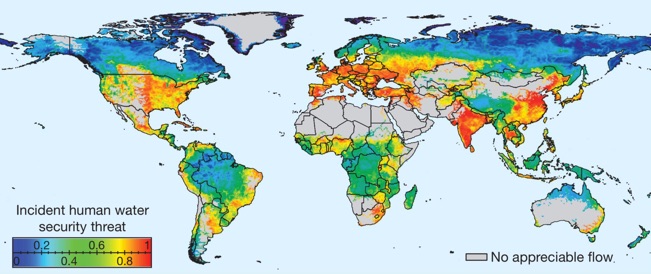
Key pollutants include nitrogen (particularly reactive nitrogen)2, phosphorous, mercury and other heavy metals, pesticides, organic matter, salt, acids, and sediments. Part of these pollutants have agriculture as their main source. Pollution is a threat to human water security (Fig. 4).
In 2016, the UN Environment Programme (UNEP) estimated that 70 to more than 400 million people were exposed to contaminated surface water in the world [read]. The idea that water pollution would be more in poor than in rich country is not confirmed by facts, mainly because economic development has been a source of new pollutants generated by increased human activities, both industrial and agricultural, despite more water being processed in waste water treatment plants.
Fig. 4: Global geography of incident threat to human water security
Source: Vörösmarty et al., 2010.
Nitrogen pollution has been growing fast and 80% of anthropogenic N fixation is linked to industrial fertiliser production through the Haber – Bosch process [read] and to biological fixation in agricultural systems, the remaining 20% coming from combustion in engines and industrial power plants. Reactive nitrogen is a major factor of water quality degradation. It generates eutrophication of surface water, deteriorates soil quality by acidification and is a cause of loss of soil biodiversity. It affects plant and insects (including pollinators), and impacts the composition of vegetation and grazing animals. In Europe, the total annual cost of nitrogen pollution’s environmental effects was estimated between 70 and 320 billion euros [read].
The quantity of phosphorus released in water has been evaluated at about 1.47 million tons/year, of which 38% is due to agriculture (mostly fertiliser and dejections from intensive animal production units), the rest coming from domestic or industrial sources [read]. More than half is occurring in Asia (30% for China alone), followed by Europe (19%), Latin America and the Caribbean (13%) and North America (7%) [read]. Like reactive nitrogen, phosphorus in water causes eutrophication.
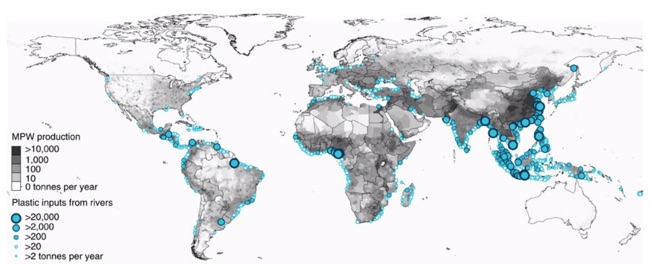
Plastic pollution of water has been much talked about, of recent. From almost nothing in the early 1950s, world production has reached close to 400 million tonnes, annually. Estimates are that between 1.2 and 2.4 million tonnes of plastic are carried every year by rivers towards the sea, with Asia accounting for 2/3 of this total [read] (Fig. 5).
When degrading into micro- and nanoplastics, plastic is present everywhere and it has been detected in marine water, wastewater, freshwater, food, air and drinking water, both bottled and tap [read]. For example, a recent study [read] found airborne microplastic at Pic du Midi Observatory (at 2877 m asl), in the Pyrénées, France, that probably landed there carried by intercontinental and transoceanic airstream.
The ubiquity of plastic in the environment also includes its presence in food and, ultimately, in people [read]. The direct health effects of plastic on humans are not well understood but scientists believe that in cases of high consumption, it could represent a health hazard, given the toxic nature of some of its components.
Fig. 5: Map of the mass of plastic carried by rivers towards the ocean
(in tonnes per year)
Source: Lebreton et al., 2017
Note: MPW, mismanaged plastic waste
A large number of other pollutants can be found in water. Organic compounds make the major part of these items and they include pharmaceutical substances (i.e. antimicrobials [read]) and personal care products, hormones, food additives, pesticides, preservatives, detergents, disinfectants, surfactants, flame retardants, etc. [read]. It is estimated that every year, in the United States, more than 1,000 new chemicals are released into the environment, many of which end in water.
Irrigation and the huge efforts to develop and manage irrigation infrastructure
During the 1980s, irrigation benefitted from close to 30% of the agricultural loans made by the World Bank. In Mexico, 80% of public expenditure for agriculture between 1940 and 1990 was dedicated to the development of irrigation. In the case of China, Indonesia and Pakistan, half of public expenditure for agriculture went to irrigation development. In India, 30% of all public investments were for the establishment of irrigation schemes [read].
The peak of investment in irrigation occurred at the end of the 1970s, and it had been halved by the end of the 1980s.
Asia has 70% of the world’s irrigated land, of which half is located in China and India. By 2005, there were altogether around 40,000 pieces of hydro-agricultural infrastructure of more than 16 metres high in the world.
The maintenance and management of irrigation infrastructure were highly subsidised by governments. In the middle of the 1980s, it is estimated that irrigation subsidies in six countries of Asia represented on average 90% of total maintenance and management costs.3 Some case studies showed that irrigation fees paid by producers were equivalent, on average, to less than 8% of the benefits drawn from irrigation.
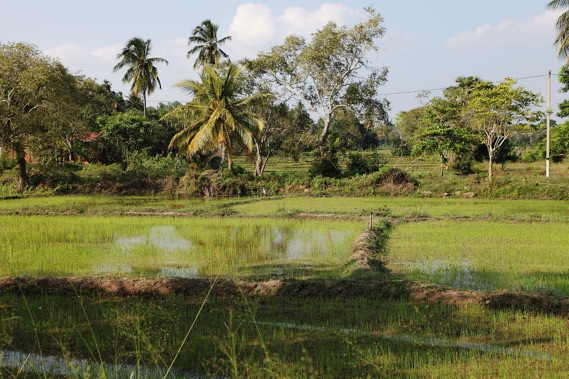
Despite efforts made, it must be admitted that irrigation water is not managed efficiently. Now that awareness of the value and scarcity of water is higher, the strategy followed is changing, and rather than continuing to build new infrastructure, the thrust is on how to improve the efficiency of what is already in place (there are plenty of existing, degraded and unused irrigation infrastructure throughout the world).
This redefinition is strongly justified as estimates suggest that more than half of irrigation water goes wasted. Moreover, pumping of underground water has often led to the overexploitation of aquifers and the progressive lowering of the water table. This is particularly true in China, Egypt, India, Mexico and in North Africa. Poor drainage in a large proportion of irrigated areas has also caused waterlogging and salinisation. Around 25% of irrigated land in the South is thought to be subject to various degrees of salinisation. This will gradually make part of the existing irrigated area less productive or even unsuitable for cultivation.
There are two further types of investments besides the effort to rehabilitate and improve the management of existing infrastructure. They are essentially: (i) mega-projects such as the projects of water transfer from the South to the North of China and the construction of inter-river links in India which seek to move water from surplus areas to regions where there is a water deficit; and (ii) small-scale collective or individual investments to establish small irrigation schemes and water pumping facilities.
Benefits of irrigation have been shared unequally
Because of its central role in increasing agricultural productivity and production, irrigation has been mentioned as one of the main factors contributing to the decreasing trend in agricultural prices between 1960 and 2005.4 This decreasing trend has mostly benefitted poor consumers whose diet is based on cereals, and it helped keep wages low in urban areas. Through irrigation, agricultural prices have become more stable which contributed to stabilise production. The increase in agricultural production and its processing has allowed the creation of new jobs.
Those producers who have irrigated land, have also seen their standard of living improve considerably. But they are often reduced to a minority, as in many countries irrigated land has largely been taken over by local rural elites to the detriment of the poorer sections of the population. Good data on the distribution of irrigated land is, however, quite difficult to find.
Here are some examples that illustrate this point. They are based on the results of agricultural censuses:
•In Nepal, only half of the farms have access to irrigated land [read];
•In India, the 1% farms who have more than 10 hectares also own 11% of irrigated land, while the 62% of farms with less than 1 hectare only have 21% of irrigated land;
•In Vietnam, women-headed farms have, on average, less irrigated land than those headed by men (0.37 hectare for women against 0.52 hectare for men);
•In Mexico, only 17% of farms have irrigated land;
•In Tanzania, 7.5% of farms have access to irrigation;
•This proportion is less than 1% in Ghana.5
The upstream development of irrigation may also have negative consequences for people living downstream, either by reducing the quantity of water that remains available to them to irrigate their crops or catch fish, or by degrading the quality of the water they use. This may create tension among countries living in the same river Basin (e.g. the Nile Basin, the Mekong Basin or the Niger Basin). Indeed, some countries depend heavily on rivers coming from neighbouring countries. Botswana, Bulgaria, Cambodia, Congo, Egypt, the Gambia, Hungary, Luxembourg, Mauritania, the Netherlands, Syria, Romania and Sudan receive more than 75% of their water from rivers coming from their upstream neighbours.6
Irrigation has also brought an increase in the occurrence of certain diseases (filariasis, diarrhoea, dysentery, typhoid, hepatitis, etc.): it is estimated that in India in 1998, 44 million people suffered from diseases linked to the establishment of irrigation infrastructure.
There are also many examples of cases where people were expelled often without compensation to free space for reservoirs that were to be created because of the construction of new dams.
There is generally a close link between lack of access to water for production and consumption, and poverty. On the one hand, social inequalities are more important in irrigated areas than in rainfed agriculture areas. On the other hand, it is the poorest regions in the world that face the greatest difficulties in capturing and using their water resources sustainably.
There is some debate as to whether the choice to give priority to irrigation rather than to the development of dryland farming, has been the best possible option. On one side, expanded irrigation certainly had extremely positive effects on the level and stability of agricultural production and on food prices. This effect was beneficial for consumers. On the other side, however, one may criticise the fact that a largely publicly funded irrigation was developed to the benefit of a minority of producers. One may also lament that the development of irrigation went hand in hand with the adoption of agricultural production technologies which have had a strongly negative impact on the environment. One may also question whether it would not have been possible to develop productive rainfed agriculture technologies that would have benefitted a much larger number of producers, with the same amount of financial resources that were mobilised to foster irrigation. The development of irrigation was clearly a “hardware option to development” as it was conducted through huge building efforts and as it contributed to the expansion of a capital intensive chemical industry which also had disastrous consequences for the environment.
Agriculture will have to adapt as it will face increasing competition for water from other sectors
There will be a need to improve irrigation and water management techniques to try to avoid putting under further pressure a resource that is already being overexploited in many parts of the planet. Beyond this, the very structure of agricultural production will have to be modified to reduce the water content per kilogram of produce.
It is now well established that animal proteins require more water than vegetable proteins to be produced. The rapid increase of demand for animal products resulting from the development of a large middle class in non-industrial and emerging countries is exerting a growing pressure on water resources, particularly for the production of animal feed. This makes some experts believe that the real reason behind the land grabbing movement observed in recent years is in fact the quest for water.
This means that it will be indispensable to turn seriously to the improvement of dryland farming productivity.
Conclusion
Water is a prerequisite for life, and it plays a central role in agriculture which is its main user. The accelerating expansion of areas under water stress in the world, and the degradation of water quality due to human activities, threaten the sustainability of production of our food.
Food and agricultural technologies using and discharging into the environment a growing number of various products (fertilizers, pesticides, organic matter, salt, acids, antibiotics, hormones, food additives, preservatives, etc.), are causing a greater concentration of damaging substances in water that harm human health and the environment, and threaten biodiversity.
Scientists think that climate change, that is already felt with increasing violence, suffering and misery, by elevating temperatures and modifying rainfall patterns, will contribute to the multiplication of water stressed areas, making certain parts of the planet unliveable, and threatening future global food security [read].
These trends call for a reorientation of our food and agricultural strategies, policies and programmes, in addition to improving the efficiency of irrigation systems:
•Act and redesign food consumption and production so as to reduce its impact on climate and its polluting nature. This will require, inter alia, to reengineer agricultural production technologies in order to use more effectively natural processes, rather than seek to create uniform and artificial conditions [read] and to adopt less water-intensive diets;
•Shift from a fragile, wasteful and inegalitarian “all-out irrigation” strategy to a more balanced approach giving more importance to rainfed food production. This will require conducting more in-depth work leading to genetic improvement, diversification of species and the use of synergies and symbiosis opportunities, and greater reliance on an intensive use of natural processes [read].
This reorientation will also require a substantial mobilization effort and a repositioning of scientific research to develop technologies better adapted to diversified local conditions [read], more environment- and climate-friendly, and more accessible to the mass of small agricultural producers [read].
This shift remains possible and is a source of hope.
Of course, as always, it will not be easy, as forces opposing change will come up, seeking to protect their interests and profits. To overcome their resistance, there will be a need for a political and citizen mobilisation at local, national and global level.
(February 2022)
------------------
Notes:
1.This text updates and complements “Water and Hunger - The ‘‘all-out irrigation’’ strategy has led to - a fragile, wasteful and inegalitarian system” published on hungerexplained.org in 2013.
2.Reactive nitrogen includes nitrous oxide, nitrates, nitrites, ammonia and ammonium that are components active biologically, photochemically, and radiatively, contrarily to the N2, which is a rather inert gas that constitutes 80% of the atmosphere. Although natural processes, such as cyanobacteria, can create reactive nitrogen, human activities are its major source mainly through fertilizer and fossil-fuel combustion, and various industrial activities such as the manufacturing of ammunition [read].
3.R. Repetto, Skimming the water: rent-seeking and the performance of public irrigation Systems. Research Report No. 4. WRI, Washington, 1986.
4.After 2005, prices started to increase for a number of reasons [read].
5.Xinshen Diao, Importance of Agriculture for Sustainable Development and Poverty Reduction: Findings from a Case Study of Ghana, IFPRI, 2010.
6.IWMI, Farmer-led irrigation schemes could alter food security in sub-Saharan Africa, South Asia, August 2012.
——————————-
To know more:
•FAO, The State of the World’s Land and Water Resources for Food and Agriculture – Systems at breaking point. Synthesis report, 2021, Rome.
•FAO, The State of Food and Agriculture 2020. Overcoming water challenges in agriculture, Rome, 2020.
•FAO, Agriculture and Water Scarcity: a Programmatic Approach to Water Use Efficiency and Agricultural Productivity, Committee on Agriculture of the FAO, Rome, 2007.
Selection of past articles on hungerexplained.org related to the topic:
Last update: February 2022
For your comments and reactions: hungerexpl@gmail.com
